On a population level, the EBV to WBV correlations for the carcase related WBVs are generally high. However, we acknowledge that over 500,000 animals, some individuals, including some high accuracy sires, have changed more significantly.
Much of the change between prior EBVs and current WBVs can be attributed to the genetic evaluation model implemented to generate the carcase related WBVs. This model (and enhanced genetic evaluation software) essentially removes the requirement to pre-adjust (pre-correct raw data) carcase traits to a standard carcase weight end point.
Commercial Wagyu carcase production is typically not to a standard carcase weight. Rather, commercial Wagyu supply chains operate to fixed days on feed, which allows measurement of the expression of traits at a given age. The AWA’s new genetic evaluation fits age of the animal as a fixed covariable for carcase weight (ie. accounting for age differences), with the relationship between carcase traits captured by their actual correlations to other traits, not using data pre-adjustments.
Pre-adjustment of data is a process of regressing data to a mean, to simplify the genetic analysis of large population datasets by removing variation. In Wagyu BREEDPLAN, it included the adjustment of carcase trait raw data. For low carcase weight animals, these were adjusted up to a mean and the carcase trait records for high carcase weight animals were adjusted down to a mean. This ‘correction’ of data adjusted all raw carcase data to a carcase endpoint standard (i.e. previously a 420 kg weight end point was applied).
With this model change (without pre-adjustment to a common carcase weight) we have generally observed higher growth animals increase for the carcase traits in the transition to WBVs, while lower growth animals have generally decreased. This is a direct result of the analysis model change and because data pre-adjustments to a standard carcase weight have been removed from the genetic evaluation model.
To demonstrate this change, we have compared marbling score and rump fat prior EBVs to current WBVs for high use sires with more than 200 progeny. Shown in Figure 1 is the relationship between prior EBVs and current WBVs for marbling score (MS) for animals in the top quartile for carcase weight (blue dots) vs animals in the bottom quartile for carcase weight (orange dots).
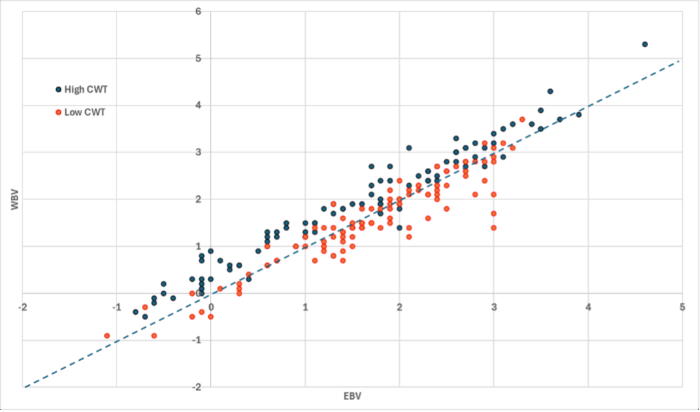
Figure 1. The relationship between Marble Score (MS) EBV to WBV change comparing high-use, Full blood or Purebred Wagyu sires with divergent carcase weight WBVs (high CWT sires blue, low CWT sires orange).
Although these sires range in CWT WBVs from +90 to -50 (a 160kg CWT WBV range), there is significant overlap between the marbling score EBV to WBV relationship for high and low growth animals (vertical change). However, we see a general trend for a slight increase in MS WBV for higher growth animals (blue dots tend to sit higher on the vertical axis) at any given MS EBV.
Importantly, we still observe high growth and low growth sires that rank high for MS WBVs (right hand side of x axis) and low for MS WBVs (left hand side of x axis). This is a reflection that the genetic correlations between growth and marble score are low and you can select for marbling score independent of growth if you want to. Equally, you can select for high growth sires that are also high marbling.
Looking at a non-eye muscle area measured trait, Figure 2 shows a similar relationship for the Rump fat WBV.
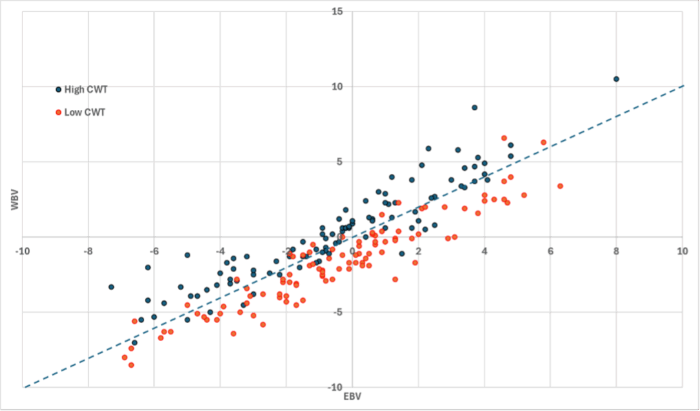
Figure 2. Rump Fat EBV to WBV change comparing high-use, Full blood or Purebred Wagyu sires with divergent carcase weight WBVs (high CWT sires blue, low CWT sires orange).
Across sires with a significant range of 160kg CWT WBV range, there is significant overlap between the Rump Fat EBV to WBV relationship (vertical change). However, we also see a general trend for an increase in Rump Fat WBV for higher growth animals (blue dots tend to sit higher on the vertical axis) at any given Rump Fat EBV. This is aligned with a moderate positive genetic correlation between carcase weight and rump fat.
Summary:
With the transition from EBVs to Wagyu Breeding Values (WBVs), some members have noticed changes in the carcase related breeding values for traits such as Marble Score. Across the population, the new WBVs generally remain highly correlated with the previous EBVs, but it is expected (and has been observed) that certain individual animals, including some high accuracy sires, will show larger shifts than others.
Much of the change stems from the introduction of a new genetic evaluation model designed specifically for calculating carcase-related WBVs without raw data pre-corrections. Under the previous model, carcase traits were preadjusted to a fixed carcass weight endpoint (ie a 420 kg carcase). The updated model, supported by enhanced genetic evaluation software, no longer requires these precorrections and includes Wagyu-specific parameters.
By removing the forced adjustment to a standard weight, the WBVs better reflect how Wagyu cattle express carcase traits under commercial long-fed systems, where animals are generally fed to a specific number of days on feed rather than harvested at a uniform carcass weight. This aligns the evaluation with the way most Wagyu are grown to optimise marbling based on economics and production goals, instead of a fixed weight market end point. Where previously high-ranking animals have changed significantly between EBVs to WBVs, this is a result of the genetic evaluation model change and removal of data pre-correction.
In short, the new WBVs better reflect Wagyu raw data and the Wagyu commercial production system. We continue to see both high growth and low growth sires ranking extremely well for traits like Marbling Score and Rump Fat, and vice-versa. This reflects the fact that the genetic correlations between carcase weight and these traits are not 1:1, meaning that while growth influences the expression of some carcase traits, they remain genetically distinct. The updated WBVs simply provide a clearer, more commercially relevant picture of these genetic differences within the breed.