There has been information put forward to Wagyu breeders comparing the American BIF accuracy calculated for EPDs against those calculate for EBVs by the rest of the world.
In reviewing this information, it is not just important to clarify how one accuracy calculation compares to another, rather, it is important to understand the precision in which you can use EPDs or EBVs based on the data that supports their calculation.
USA EPD Accuracy: If you conduct an EPD search on the American Wagyu Association Digital Beef platform and use the following criteria, minimum IMF Accuracy .01, Fullblood, Black, Males, only animals born between 01/01/2024 and 05/30/2024 and press ‘search”, 496 animals are reported that are born in that period that have IMF (marbling) EPDs. You can click “Export to Spreadsheet” and “Download Spreadsheet” to further view and average the results.
In total, EPDs for 9 traits are reported. For the 496 animals, the average Accuracy of the IMF EPD is 0.19 and the average Accuracy of the CW EPD is 0.18.
Looking at error range in an average accuracy EPD animal with an IMF Acc 0.19 and CW EPD Acc 0.18, the following example is provided where error is ±1 unit of standard error.
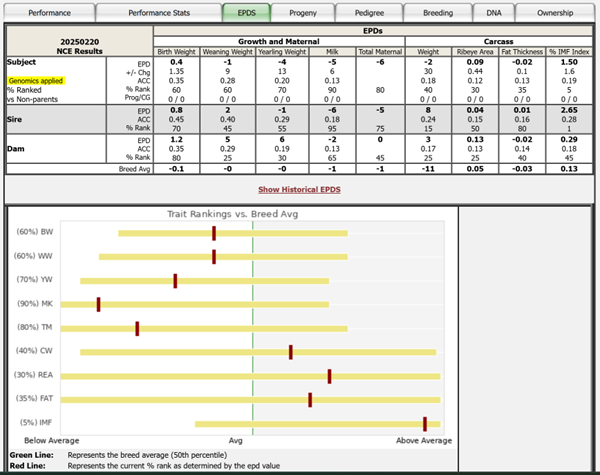
Looking at the Trait Rankings (Red Line) vs. Breed Average graph at the bottom of the window, you can see the error range (Yellow Bar), which is the range of potential ranking change based on possible change expected is significantly more than half the breed range for both IMF and CW.
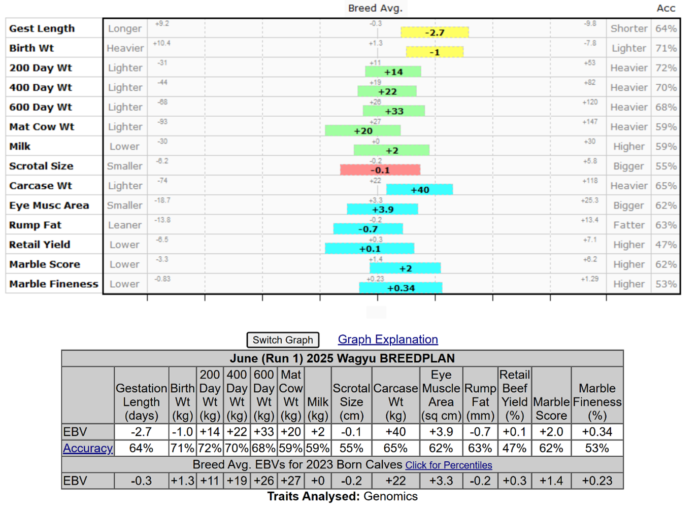
AU EBV Accuracy: If you conduct an EBV search on the Australian Wagyu Association BREEDPLAN page and use the following criteria, minimum IMF Accuracy 0, Fullblood, Black, Males, Calving year 2024, Sort by Date of Birth and press Search. Select the first 500 animals and copy to a spreadsheet.
In total, EBVs for 14 traits are reported. For the 500 animals, the average Accuracy of the MS (IMF) EBV is 0.62 and the average Accuracy for the CWT (CW) EBV is 0.65.
Looking at the error range in an average EBV animal with a MS (IMF) Acc of 0.62 and CWT Acc of 0.65, the following example if provided where error is ±1 unit of standard error. Looking at the error range graph with the coloured bars below, the error range for Carcase Wt. and Marble Score demonstrates a significantly reduced range of possible change for both traits.
Summary: This short communication demonstrates the relative precision of EPDs vs EBV based on animals that have genomics applied within respective genetic evaluations. The difference in accuracy of trait estimation as demonstrated by possible change in EPDs or EBVs is provided.