Genomic Inbreeding:
What is inbreeding? Inbreeding is the mating of individuals that are related through common ancestry. This can have the effect of narrowing genetic diversity in a population. High levels of inbreeding in a population are directly related to a higher incidence of homozygosity (no DNA sequence variation), which, if not controlled, can result in other issues such as congenital anomalies (genetic defects) and inbreeding depression (reduced fitness, growth and reproductive performance).
Inbreeding can be managed in individuals by outcrossing to unrelated animals to reintroduce heterozygosity (DNA sequence variation) which results in resetting to low inbreeding levels in progeny. The important thing here is that you can accurately identify inbreeding so that you can manage it if you want to.
Calculating inbreeding: The currently used inbreeding calculations, which use pedigree information in registered populations, cannot account for the relatedness of individuals within the historic Japanese Herdbook pedigrees. Although the AWA holds the most complete pedigree records for Wagyu, they typically truncate 2-4 generations prior to the export of the Foundation animals from Japan in the 1990’s. Analysis of the Australian Wagyu Association registered population by AGBU in 2019, estimated that the level of pedigree inbreeding was 6.1%.
Genomic information provides a far more advanced methodology to measure inbreeding by calculating actual homozygosity (blocks of DNA with no allelic variance) rather than pedigree relatedness. Genomic inbreeding is calculated from analyzing homozygosity using genomic SNP profiles.
AWA now has genomic profiles on more than 300,000 individuals. Calculation of genomic inbreeding coefficients across registered sires provided a range of inbreeding from 2% to 39% with an average close to 12%.
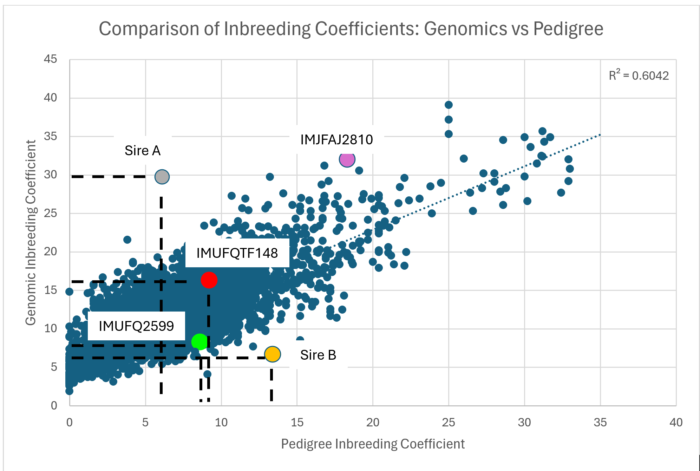
Examples: The following figure shows the relationship between pedigree inbreeding (x axis) and genomic inbreeding (y axis) across 4,700 Fullblood sires. The y axis intercept of the line of best fit is at 6%, demonstrating that genomic inbreeding is calculated to be around 6% higher than pedigree inbreeding on average. There is also a wide spread of individual data points around the line of best fit, demonstrating that there can be significant variation between pedigree (estimated) and genomic (true) inbreeding for any animal.

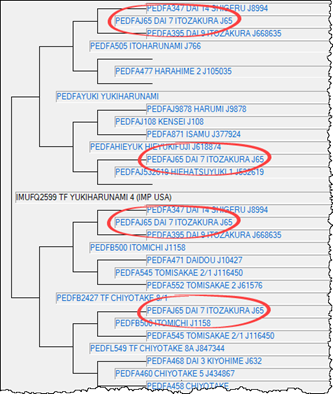
The foundation sire TF Yukiharunami 4 (IMUFQ2599) is highlighted in GREEN. Based on his pedigree records, the calculated pedigree inbreeding coefficient to Yukiharunami 4 was relatively high at 9.1%, with Dai 7 Itozakura appearing four times in his pedigree. Analysis of his genomic data shows that his genomic inbreeding coefficient is 8.2%. This means that Yukiharunami 4’s actual level of inbreeding is slightly lower than previously estimated, despite the back crossing to Dai 7 Itozakura in his pedigree.

For comparison, the foundation sire Itoshigenami (TF148) is shown as the RED dot. Itoshigenami had a predicted pedigree inbreeding coefficient of 9.7%, which is significantly lower than his genomic inbreeding coefficient of 16.7%.
Two other sires are shown where the genomic inbreeding value differs greatly from the pedigree inbreeding estimate. Sire A has almost 30% genomic inbreeding, compared to a pedigree inbreeding coefficient of 6.1%. Sire B has only 8.5% genomic inbreeding, compared to a pedigree inbreeding coefficient of 15.2%.
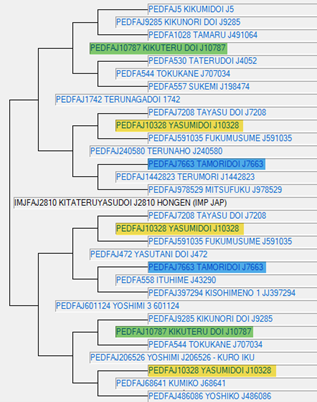
A third Foundation sire, Kitateryasudoi (IMJFAJ2810) is shown as a MAGENTA dot on the Comparison of Inbreeding Coefficients graph. His pedigree is shown below as recorded with the AWA and demonstrates a significant number of common ancestors. Kitateryasudoi himself, has a calculated pedigree inbreeding of 17.7%, whereas his genomic inbreeding coefficient is 31.1%.

It is important to note that even though Kitateryasudoi has a high genomic inbreeding value relative to the population, he is able to produce progeny that have lower inbreeding than he does, through mating to relatively unrelated females. The below graph shows a distribution plot of 92 sons of Kitateryasudoi, whose genomic inbreeding values range from as low as 5%, up to 35% inbreeding.
The above examples reiterate that the passing of genetic material from parents to progeny is random and even though one can calculate the expected inbreeding from the pedigree, analysis of the genomic information of an animal is the only objective method of assessing “true” inbreeding (homozygosity). These examples also show that outcrossing of inbred individuals can reset inbreeding to low levels. The important thing is that breeders can identify and manage inbreeding accurately.
Implications: Genomic inbreeding can be managed by outcrossing to unrelated animals to result in low inbreeding levels in progeny. For example, a sire with high genomic inbreeding could be used in a breeding program with unrelated females that have diverse genomic profiles (see item 6. Genomic Diversity). The resulting progeny will have low levels of inbreeding due to the recombination of the unrelated maternal and paternal DNA in offspring (see also Kitateryasudoi example above).
Implementation: Genomic inbreeding coefficients will be published on the Animal Details page for all animals with an acceptable (quantity and quality) SNP genomic profile recorded with the AWA. This information can be used to accurately understand inbreeding trends within herds and better manage breeding programs to reduce inbreeding over time.
